Mapping racial disparity in New York City's jail system, ZIPCODE by ZIPCODE
As part of a broader research project examining Racial Disparities in the Use of Jail Across New York City, I developed a series of maps designed to make the scale of the problem impossible to ignore. Using a combination of jail admission and census data, the maps visualize the racial and ethnic composition of each zip code's general population alongside the number of people admitted to New York City jails in 2021 from that same zip code. Four additional maps show — zip code by zip code — the extent to which Black, Hispanic, white, and Asian New Yorkers are overrepresented or underrepresented in jail admissions relative to their share of the local population.
The goal was to move the story from statistics to geography — to show not just that racial disparities exist, but where they are concentrated, and how starkly they map onto the city's existing patterns of segregation and inequality.
The New York Amsterdam News noted the maps clearly demonstrated that recent criminal justice reforms had not achieved their goals of reducing racial disparity, and that more work needs to be done.
The most rigorous research in the world goes nowhere if it can't be understood by the people who need to act on it. Visual, accessible data isn't a design choice — it's a communication strategy.
“What is highly likely is the broader structural inequities at play in perpetuating this disparity. The racial imbalance will continue unless there’s a multifaceted effort to reform other areas such as housing, education, and mental health services.”
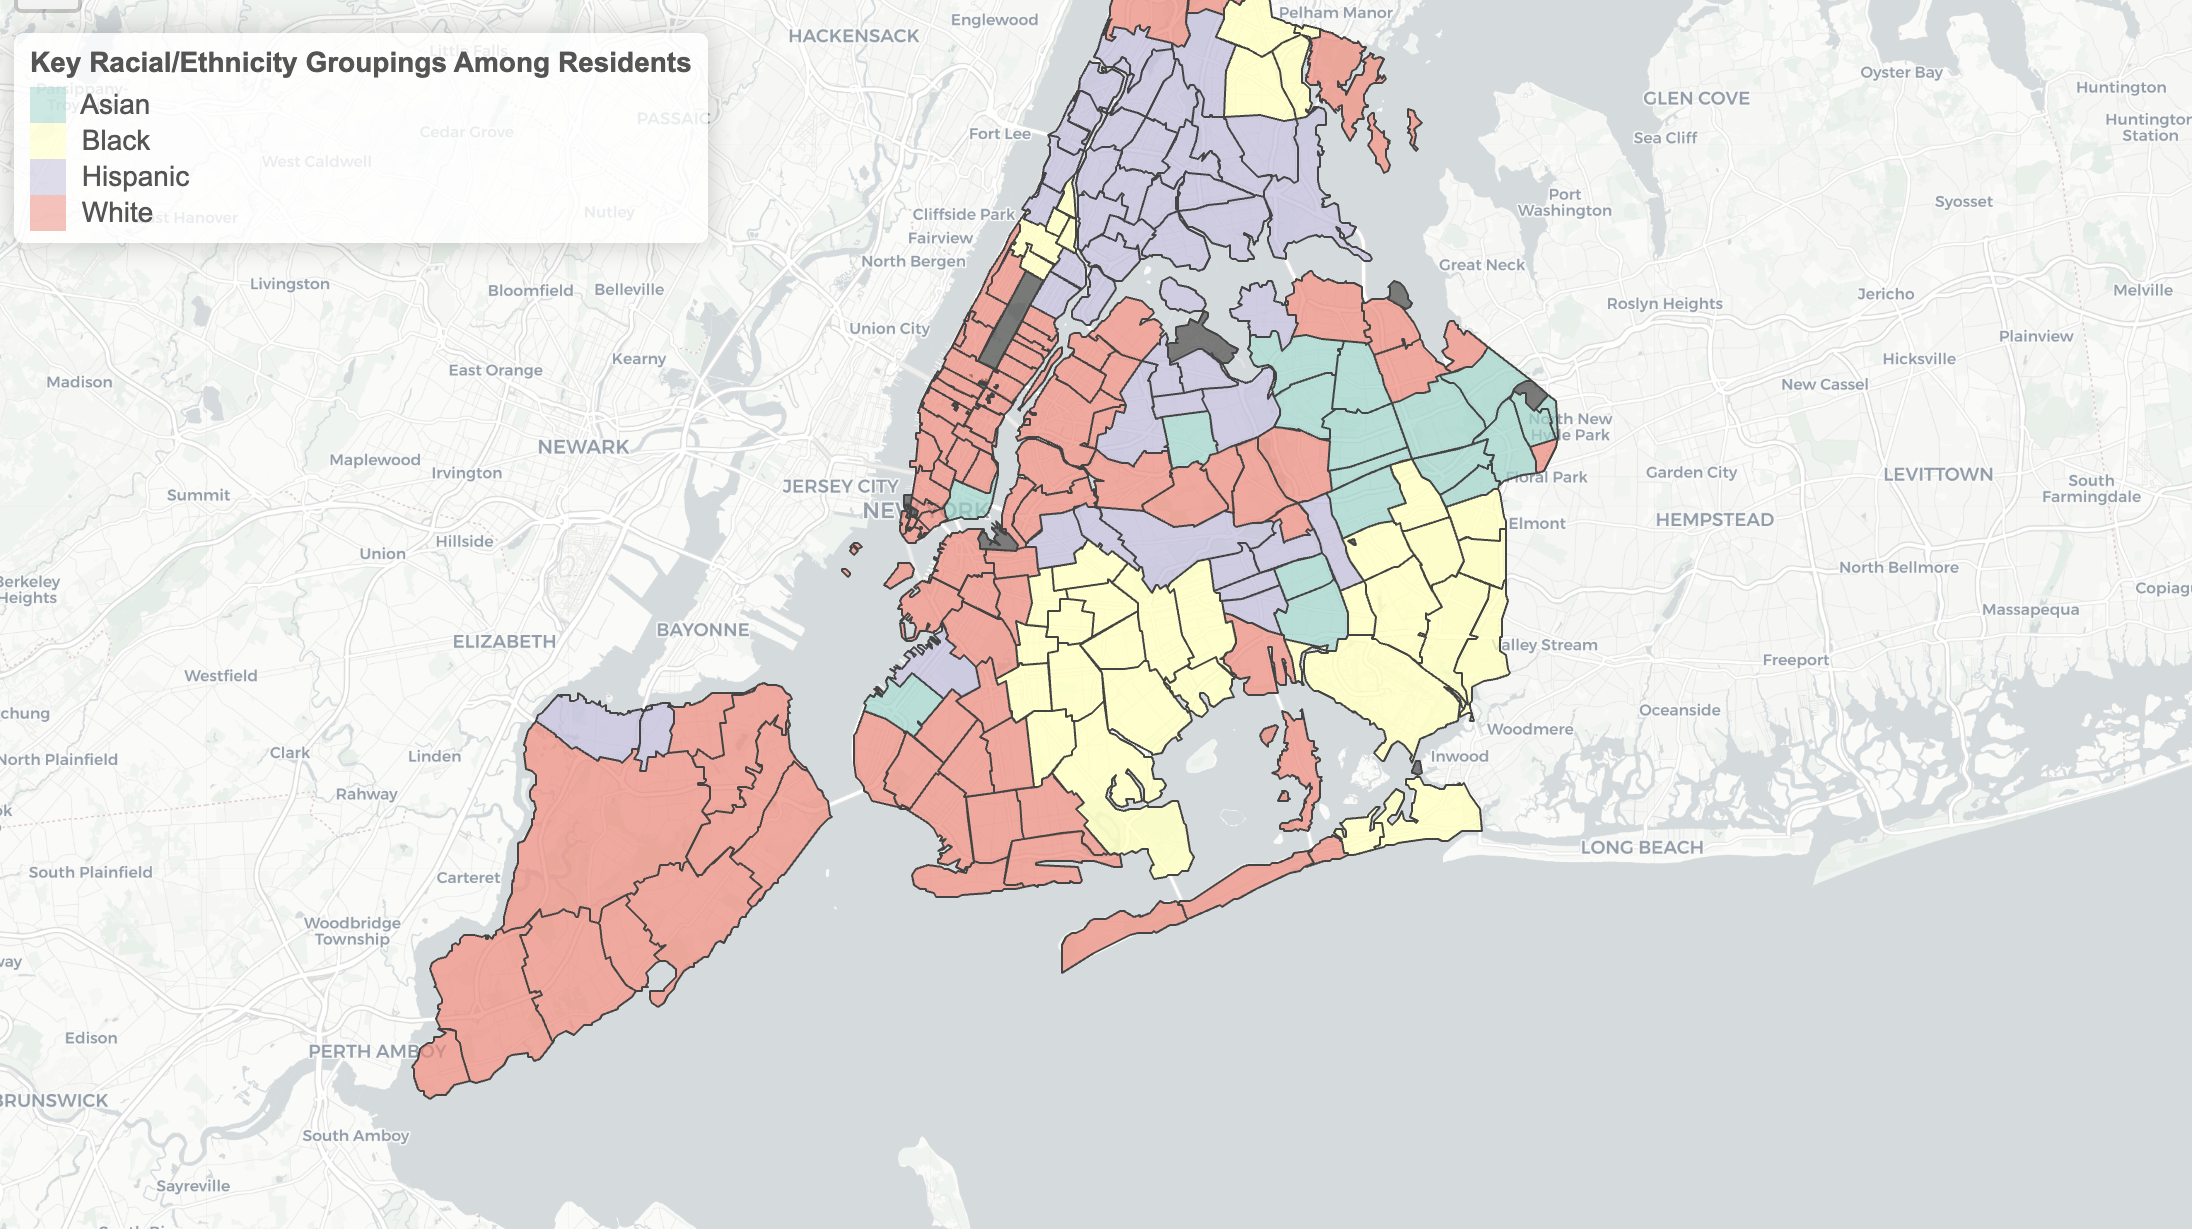
Number of Jail Admissions in 2021 by Zip Code
Disparities within Zip Codes Impacting Black People: % Jail Admissions vs. Census
Purple means Black people are overrepresented in jail admissions relative to general population, yellow means the opposite.
Disparities within Zip Codes Impacting Hispanic People: % Jail Admissions vs. Census
Purple means Hispanic people are overrepresented in jail admissions relative to general population, yellow means the opposite.
Disparities within Zip Codes Impacting White People: % Jail Admissions vs. Census
Purple means White people are overrepresented in jail admissions relative to general population, yellow means the opposite.
Disparities within Zip Codes Impacting Hispanic People: % Jail Admissions vs. Census
Purple means Hispanic people are overrepresented in jail admissions relative to general population, yellow means the opposite.
a DROP-DOWN ALLOWS EXPLORATION OF ADDITIONAL VARIABLES, FURTHER visual demonstrationS of racial disparities within NYC neighborhoods.
Data that reSONATES is data that drives change.
Visual, accessible data reaches people that statistics alone never will — cutting through complexity to land with the audiences who have the power to drive change. This project was built on the belief that how you communicate evidence is just as important as the evidence itself.